
The Spaghetti Diagram
Visualizing the Flow of People and “Things”
TOOLS
4/3/20262 min read
What Is a Spaghetti Diagram?
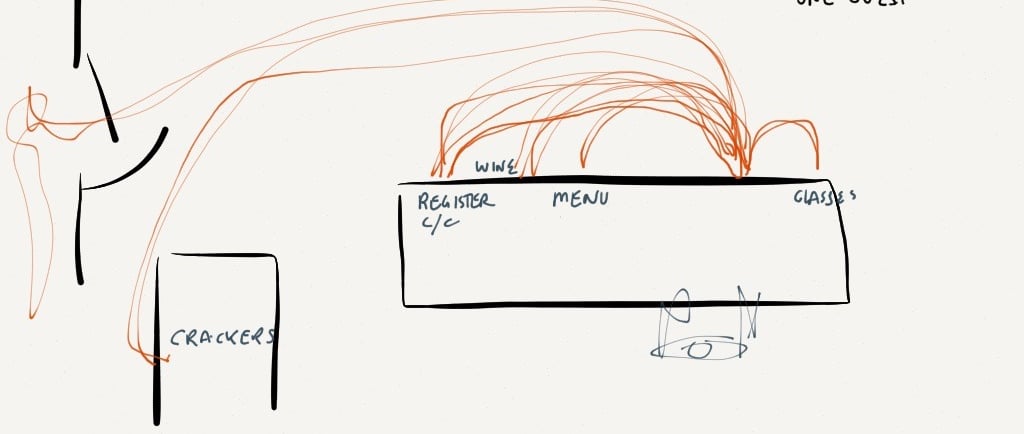
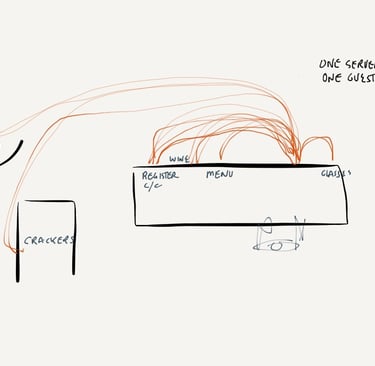
A Spaghetti Diagram is a simple hand sketch that uses a continuous line to trace the path and distance traveled by a person, a "thing," or information as it moves through a process. The result makes visible what you have learned to ignore: inefficient layouts, frequently traveled paths, and unnecessary movement.
It gets its name for good reason. When you first draw one, the lines look like a plate of spaghetti. Those tangled lines represent improvement opportunities.
How to Do It
Set Up Your Observation Pick a process to observe such as taking an order, picking and packing a shipment, processing paperwork, or anything with movement. Identify the steps in the process.
Sketch the Space Draw a roughly scaled layout of the area where the work happens. It does not need to be architectural, just accurate enough to show where things are in relation to each other.
Trace the Movement Follow the person or thing through the process and draw a continuous line showing exactly where they go. You can use different colors for different things. Use directional arrows to capture direction and backtracking. Do not leave out any movement, even if the sketch becomes cluttered. Walk the process step by step if you can.
Add Detail (Optional) Record time for each activity, including waiting time. Note the number of people or items in queues. The more data you capture, the richer the conversation will be.
Question Every Line Hold a team conversation: a quick huddle, a town meeting, or a Kaizen event (Lean Town Meeting). Invite ideas from the people who do the work every day. Look for point-of-use opportunities. Can equipment, supplies, or paperwork be stored closer to where they are actually needed? Can steps be combined? Eliminated?
Draw the Future State Create a second proposed Spaghetti Diagram and compare it to your first. You are making progress when your sketch starts to look less like spaghetti and more like manicotti.
Validate the Improvement After making changes, whether relocating equipment, redesigning the layout, or streamlining steps, draw a new observational diagram. This confirms the improvement and gives your team something concrete to celebrate.
Tips for Success
Start simple: A pencil and a rough sketch are all you need. Perfection is the enemy of insight here.
Include the people: The team doing the work always knows things the org chart does not. Their ideas are gold.
Embrace the mess: If your first diagram is hard to read, you have done it right. A clean first diagram usually means you missed something.
Look for point-of-use: The most common fix is moving things closer to where they are actually used and adjusting locations to reflect the sequence of operations: forms, equipment, supplies, anything that travels farther than it should.
The Spaghetti Diagram is one of the simplest Lean tools in existence, and one of the most disarming. It shows people what is really happening without blame, without jargon, and without anyone having to tell the team something is broken. The line does all the talking.
Use it. Share it. Then come back and tell us what you found.
DATA + PROCESS + PEOPLE = RESULTS
© 2025. Tuyeres Partners. All rights reserved.
tu·yère
/to͞oˈyer,twēˈyer/noun 1. A nozzle that injects a blast of fresh air to stoke a fire or forge.